7 Tips to optimize video content with predictive eye-tracking heatmaps
Whether you’re creating a video ad, a short version that will be placed on social or on YouTube as advertisement, you can optimize your video before publishing using the Brainsight heatmaps. In this day and age, viewers have very limited attention spans, and are distracted very soon. Keep their visual focus, and you will be able to transfer your message and brand across. Use these five tips to work on your video, and check this heatmap-example witth all video features, which will (partly) be used in the tips below:
1. Check the Clarity score
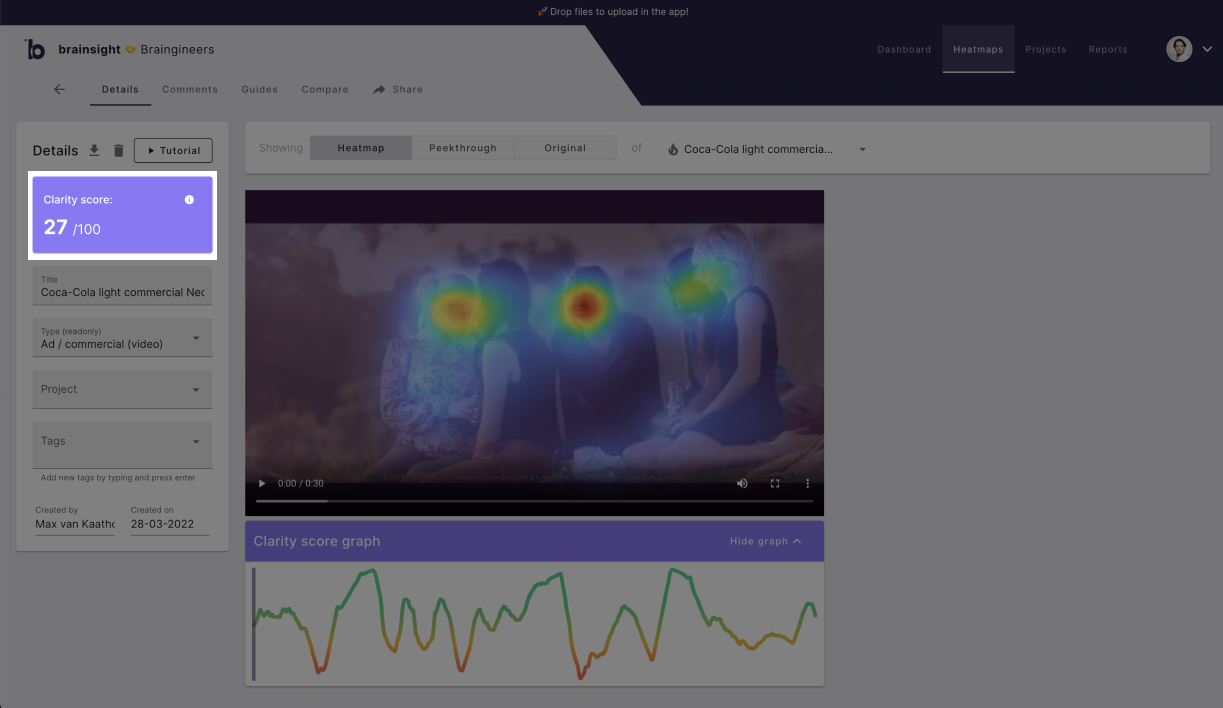
Screenshot highlighting the clarity score on the left.
If your clarity score is below 40, then you should reduce distraction in the scenes with the lowest clarity (see step 2 ↓ ).
The Clarity score is a metric indicating how cluttered vs. clear your video is in terms of visual attention. A clear video has 1 or 2 hotspots (or ‘focus points’) at the same time, so the viewer visually knows where to focus while watching your video. Every hotspot fights for the attention of the viewer and multiple hotspots result in a spread of visual attention. Some viewers might focus on one hotspot, others will focus on the other. Research shows that this will increase the chance of ad skipping. Also high clarity videos are linked to viewers' positive emotions (joy and surprise).
Brainsight instantly scores a video for clarity in an objective way, providing a rating between 0 to 100 where 50 represents the average video in our 10.000+ benchmarked dataset. A score of 0 indicates an extremely cluttered and busy video, whereas a score of 100 means your video is extremely clean and clear.
A low clarity score (< 40), means that there are more simultaneous hotspots attracting attention at the same time for most of the video.
If your clarity score is between 40 and 60 , then you should check if the scenes with the lowest clarity include scenes presenting your brand or message (see step 2 ↓ ).
2. Use the Clarity score graph
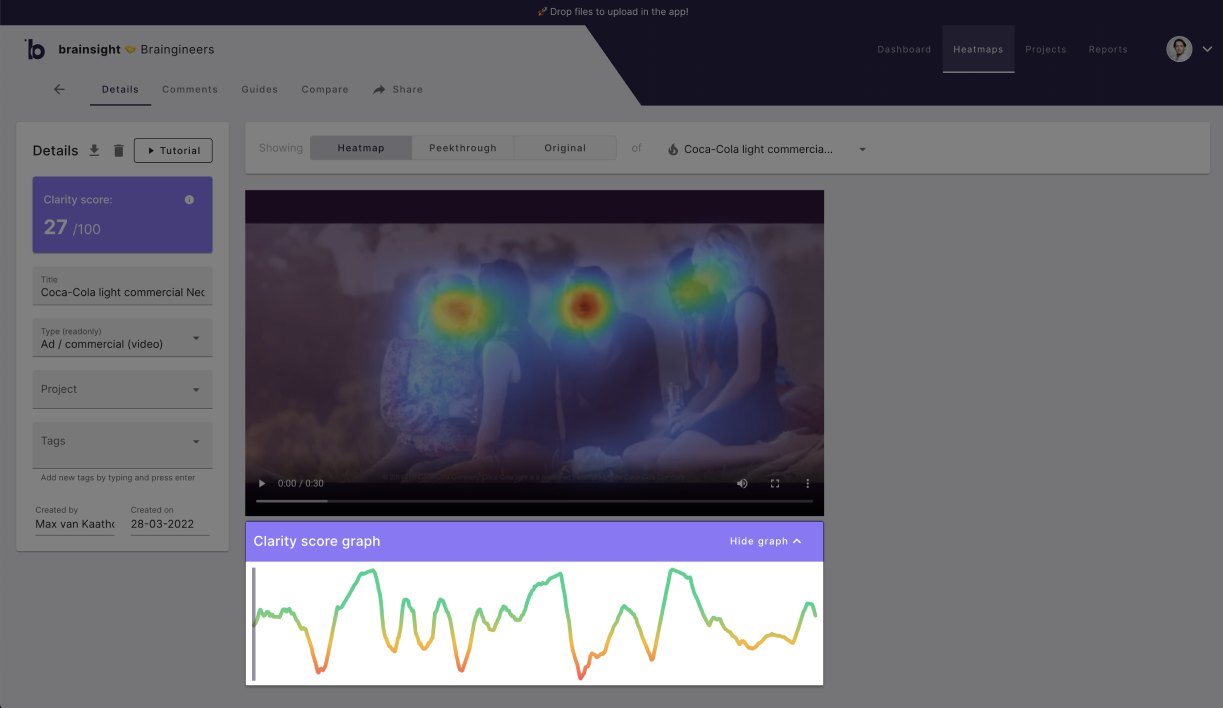
Screenshot highlighting the clarity graph below the video.
Important to know is that the Clarity score is benchmarked (in our 10.000+ ads dataset), but the Clarity graph is a visual representation of the relative clarity scores within one video ad. Because the graph is about relative differences between the scenes in one video, you will always have highs and lows.
- Red : Low clarity compared to all scenes
- Yellow : Medium to low clarity compared to all scenes
- Green : High clarity compared to all scenes
If you have a low clarity score (< 40), then you should take into account that most scenes are having multiple hotspots, and thus distractions for the viewers and should be optimized. In this example above from an old Coca Cola commercial, you see about 7 moments in the video of 30 seconds where the clarity is marked as low (red/orange colors).
If scenes with low clarity include your brand, message or website, important characters or acts, or products, then you should remove distractions in these scenes to get more attention on the important elements.
Let’s look at the example of Coca Cola:
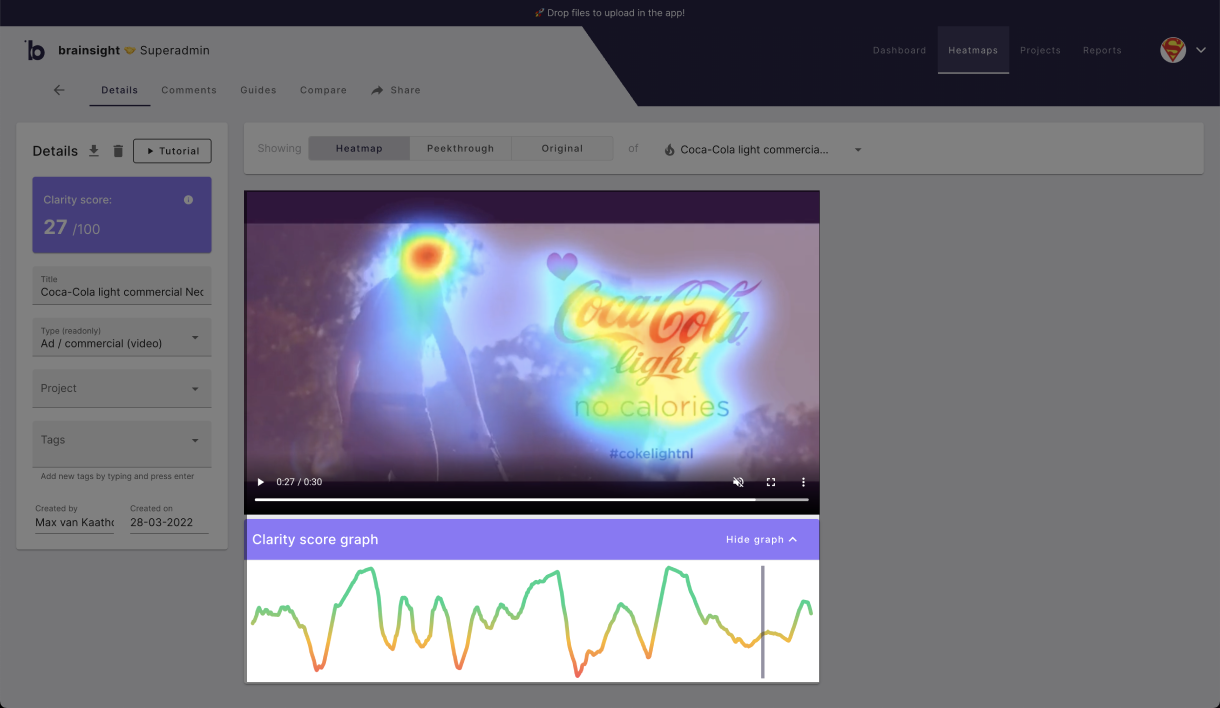
At the end, a longer scene with the brand, slogan and hashtag, is showing a lower clarity score. An important moment for the viewer to connect the video ad to the brand, and to make sure that the viewer remembers the brand after watching the video.
“One important reason end scenes need to be clear and crisp, is because they often include your brand or message, but also because in psychology there is a theory called ‘recency effect’, that explains that those items, ideas, or arguments that came last are remembered more clearly than those that came first.”
In this example, I want to know exactly how much attention is going to the brand, and how much attention is going to the actor. I’ve taken a screenshot of the video, and created an image heatmap. From there I’ve defined the areas of interest and calculated the percentage of attention.
If you’re going to improve a scene, then take a screenshot and upload the image to create a heatmap, and make use of the areas of interest.
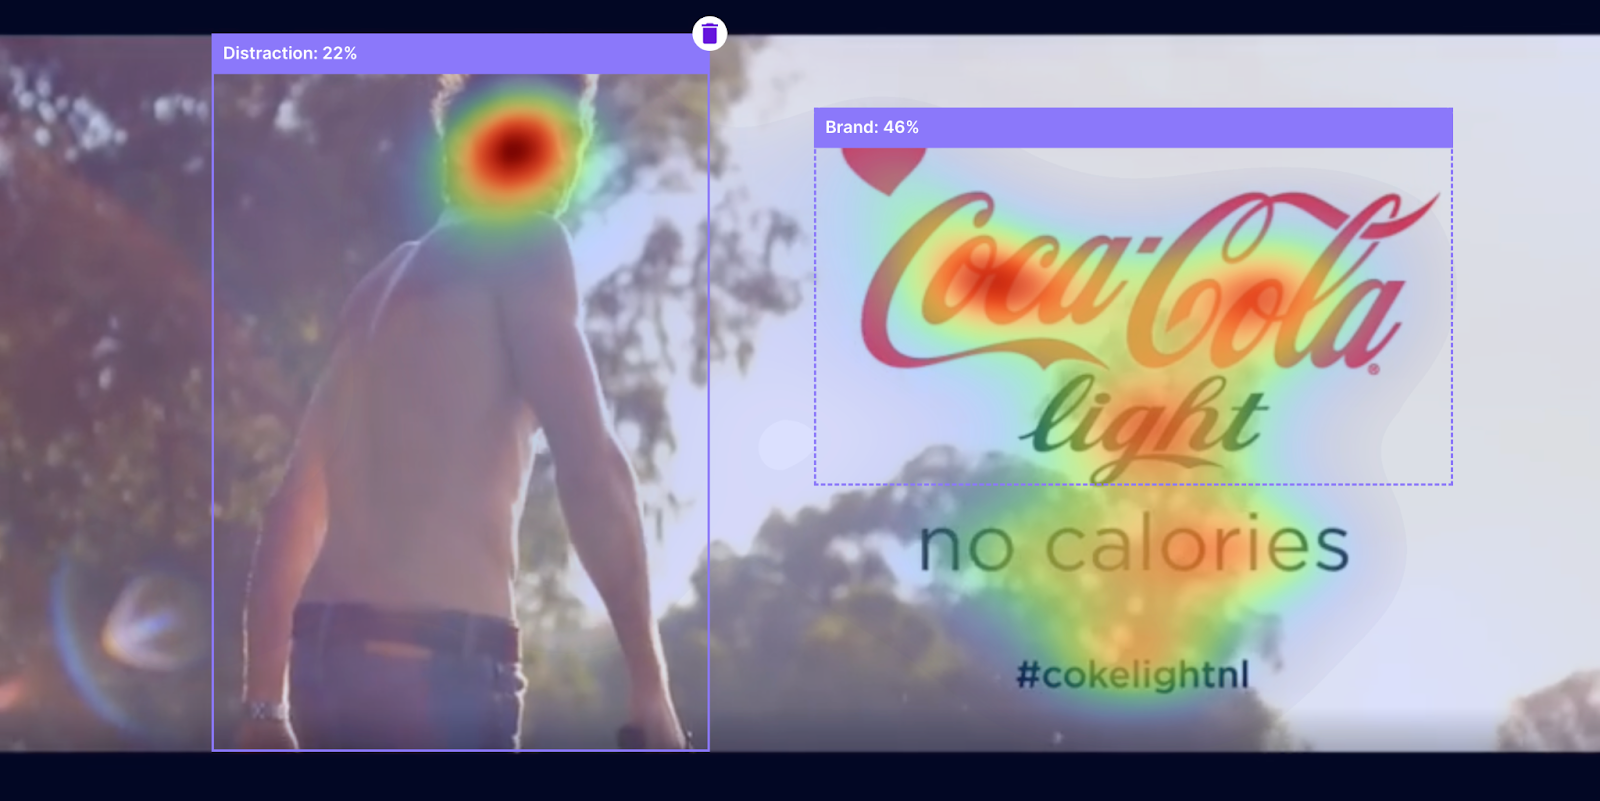
Areas of interest:
Distraction: 22%
Brand: 46%
The actor is distracting from the brand and I would like to reduce the distraction, so my first experiment would be to fade out the left side more to see if this improves the percentage of attention towards the brand. I did this simply in Figma, but you can use any design program that you have (or Paint ;)), and created a heatmap again with the same areas of interest.
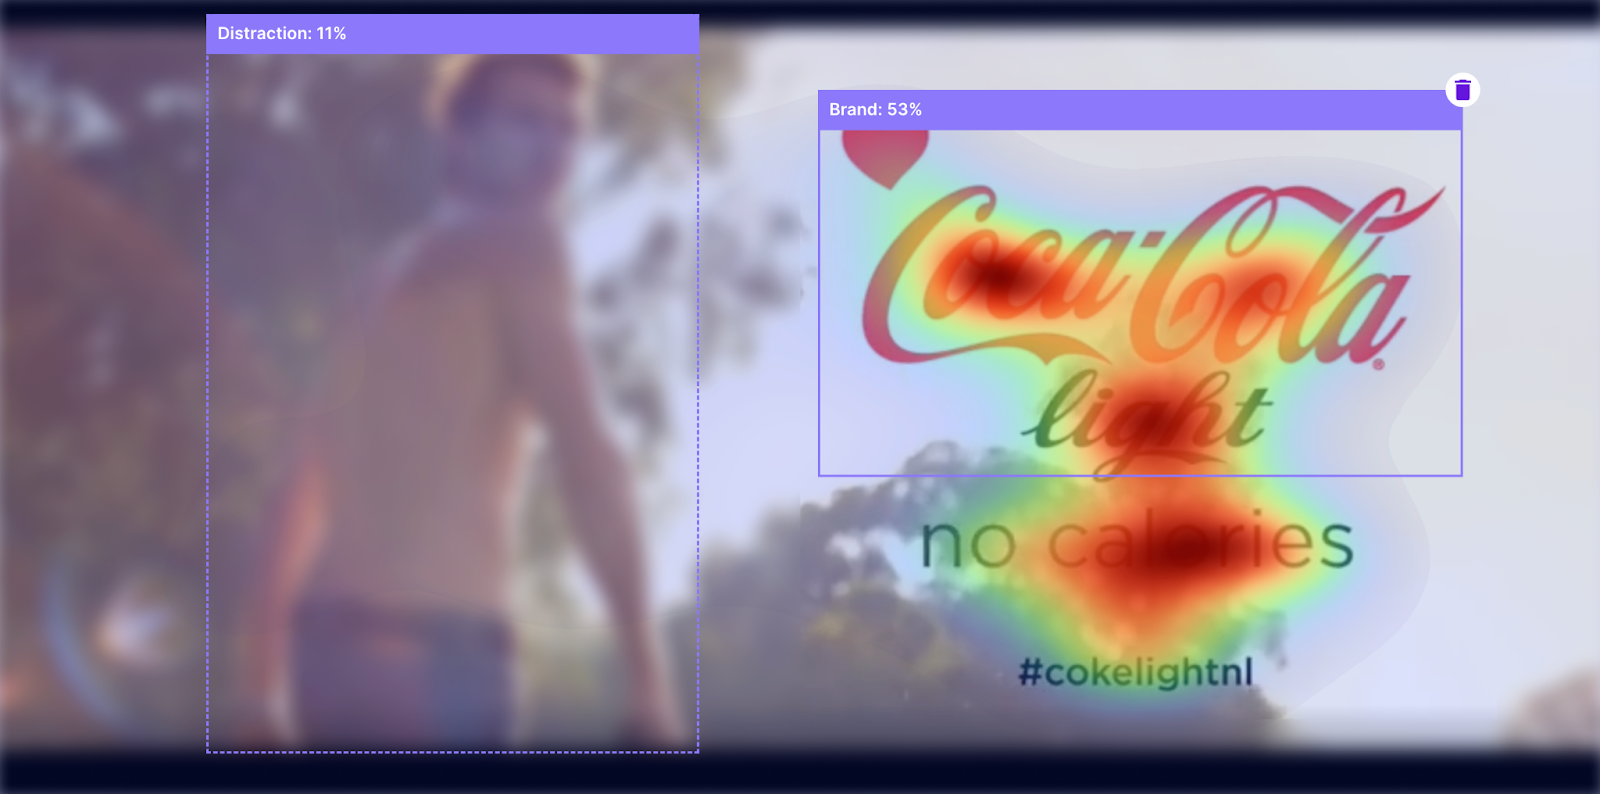
Areas of interest:
Distraction: 11%
Brand: 53%
So within minutes, we have found a suggestion to optimize the video ending shot. That is to fade out the actor and the background, and let the viewer focus on the brand.
3. Be aware of text or subtitles
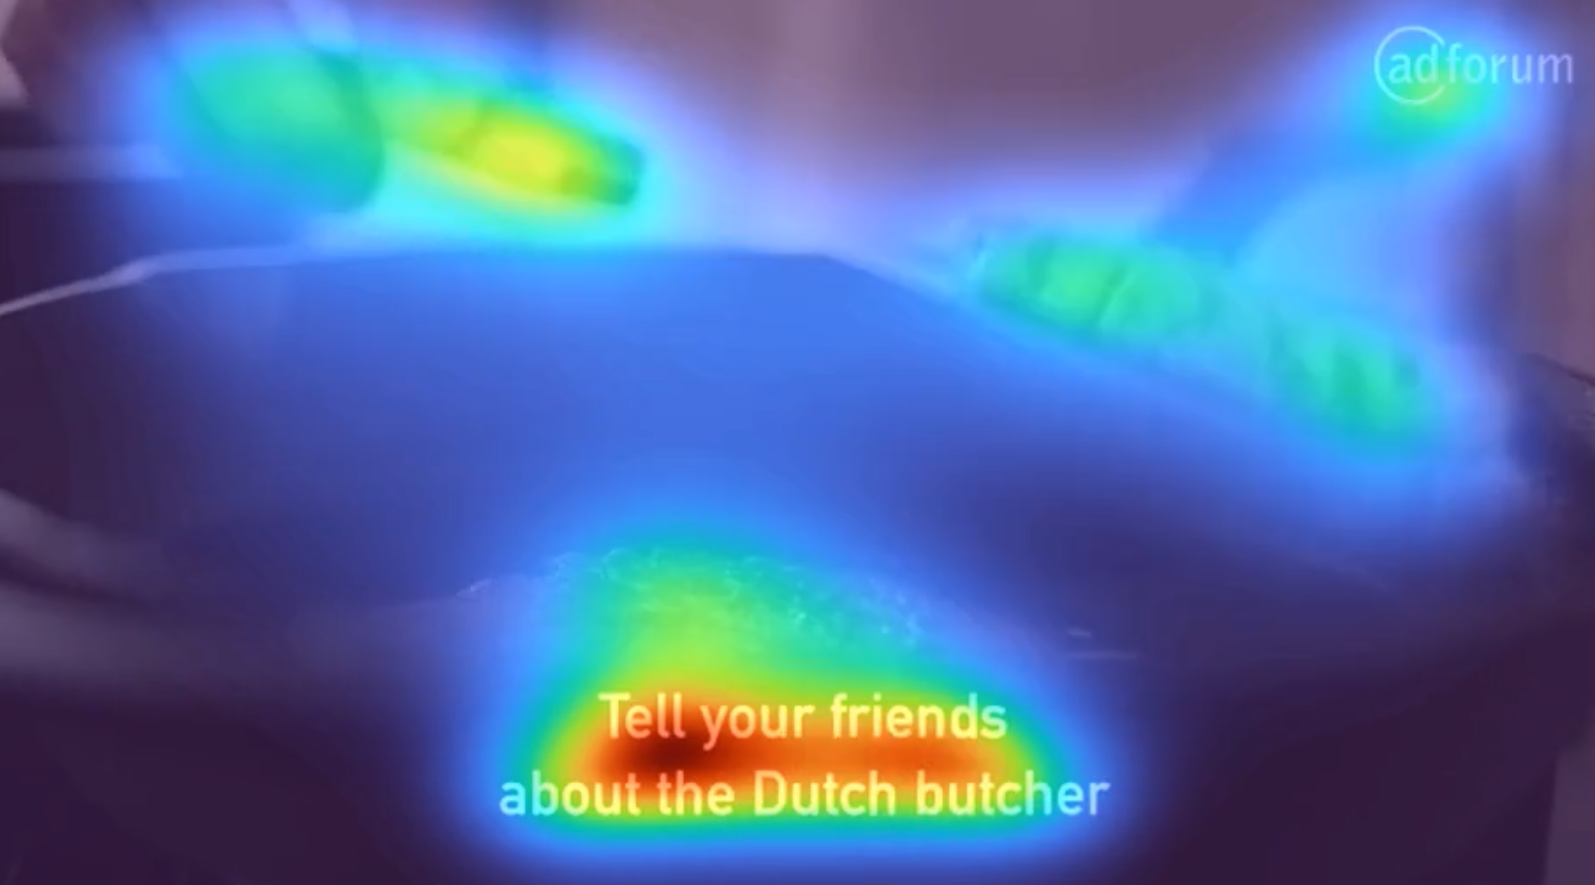
Research shows that subtitles attracted visual attention. This results in improved recall for the brand and for verbal information that was presented. However, it decreased the recall of information that is only presented visually.
Tips:
- If you use subtitles, make sure that critical information is mentioned in the subtitles, like your brand or offering.
- If the visuals in your video are significantly more important than subtitles, consider removing the subtitles from the video, because subtitles reduce recall from the visual information.
4. Using an always-on brand element or not?
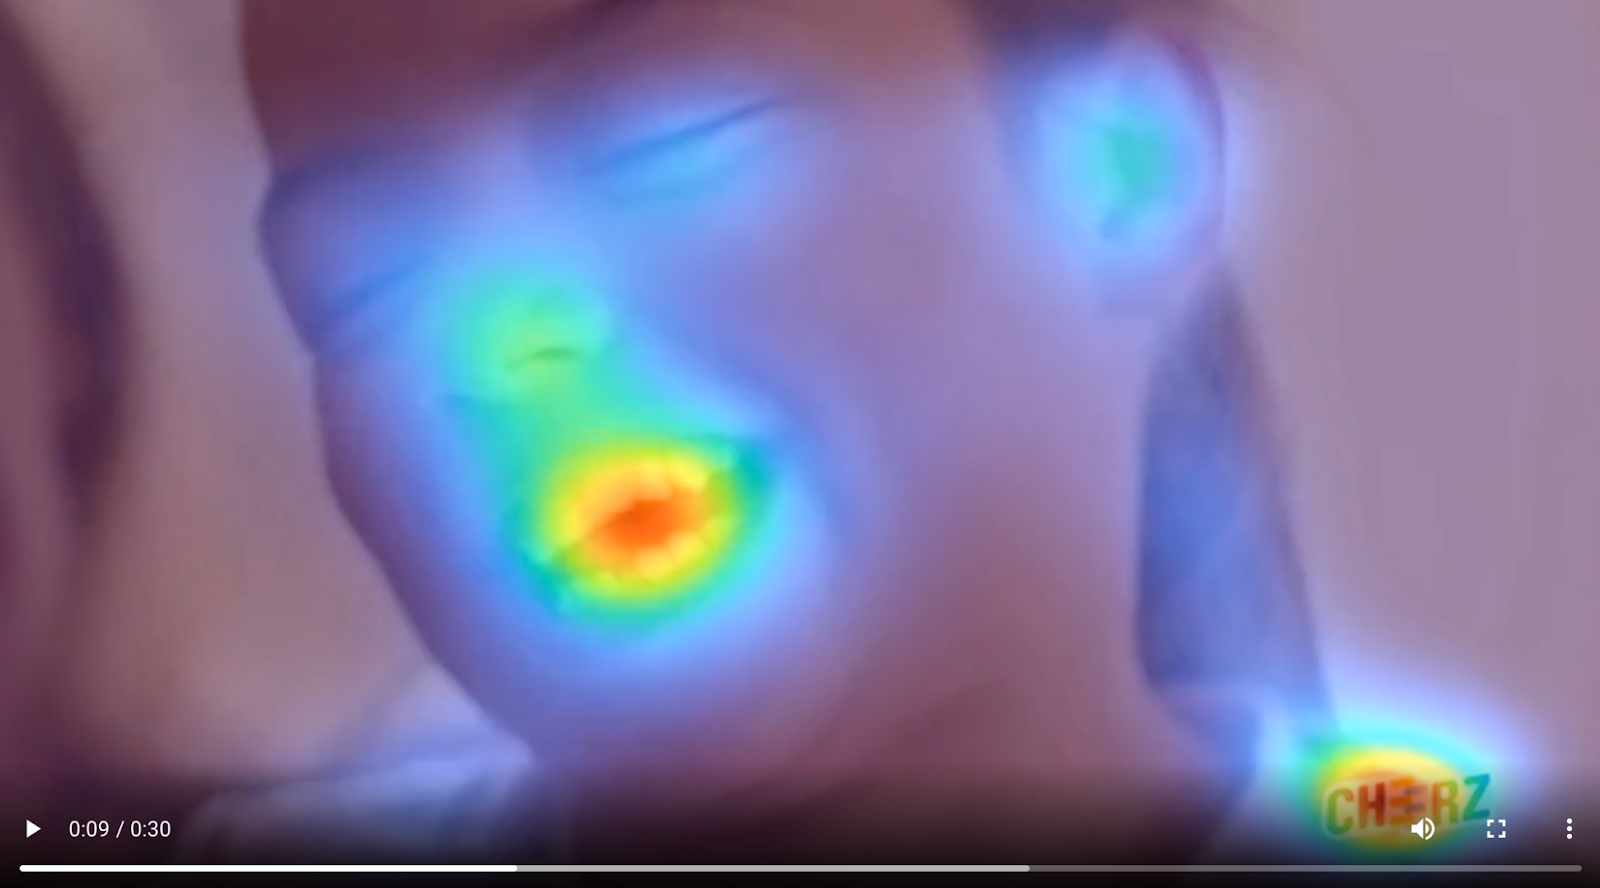
A continuous display of a brand element results in less clear video perception, because the logo will attract attention and distract viewers from the video or storyline (see example below).
In addition, research shows that the sustained presence of a brand element on the screen predicts ad skipping.
Tips:
- Try to only show your logo, when it doesn't distract viewers from the storyline and/or when you want to have a clear focus on your logo, like in the end of your ad.
- If you want to show your logo throughout your video, use brand “pulsing”, a strategy wherein the brand is shown for short intervals.
5. Choose the best thumbnail
Ready to publish your video ad on social for example, but not sure which thumbnail will be most attention grabbing? You can use Brainsight to select suitable scenes and upload them as a heatmap to see which is the most attention grabbing. In this case I’ve taken five screenshots of the Coca Cola video and uploaded them in Brainsight, marking the type as ‘social’.

For every screenshot, an attention score is calculated. This score basically answers how much chance of being seen when it’s published on a social media feed. Here you see that the end shot, with the brand, has highest attention score, and thus highest chance of being seen when shown in a feed. Still, a score of 41 can be improved, so let’s see if you can find a better screenshot.
With these tips, I’m sure you will work your way to better converting videos to survive in the age of micro attention spans.
6. YouTube Heatmap Feature
With this features (new / updated feature after the first version of this blogpost) you can easily check your thumbnail-variants in a live YouTube setting, based on relevant search terms / key words (you'll find this option under Tools). Upload your thumbnail, select the seach terms that are relevant to your video and place your thumbnail in between those of your competitors. Generate the heatmap and now you can analyze how much attention it gets when it would be live in the stream.
Tip: use the screen-capture tool in the video-heatmap to directly cut-and-heatmap a scene. Choose multiple potential Thumbnail options and compare them in the dashboard.
7. Logo Tracking
For those who have Brainsight's Brand Tracking Module, you can track your brand in video content, predicting the releative attention that goes to your brand versus the other elements in the video. Is your brand sufficiently seen? Does it stand out when it needs to be anchored to specific elements or people, such as the product or your brand ambassador? Is it (sufficiently) visible in the first 3 or 5 seconds? With the brand tracking option you are able to add new metrics and insights to your analyses and optimization toolkit.


.mp4%20-%20Heatmap.jpg)