Gaze Plots: optimizing visual hierarchy with insights from viewing behaviour

What Are Gaze Plots?
Gaze plots are visual representations of eye movement data, collected during eye-tracking studies. They offer a spatial depiction of where users fixate their gaze and how they navigate through a given interface or visual stimulus. In this blog post, we will explain what Gaze Plots are, how to analyze them and how to optimize your creative with the help of a Gaze Plot.
A typical gaze plot consists of multiple data points, each representing an individual fixation. The duration and location of each fixation are captured, providing metrics like fixations count, dwell time, and saccades (rapid eye movements). By mapping these, gaze plots provide interesting insights into viewers’ attentional focus, revealing hotspots and patterns.
Focusing on instant attention predictions, Brainsight’s Gaze Plots predict how viewers look at- and scan your creative in the first seconds after being exposed to the visual. It shows what automatically catches the eye first, followed by the next hotspot(s), thus plotting viewers’ gaze on what draws attention and in what order.
Clarity and Gaze Plots
When you need to improve your visual's Clarity, Gaze Plots provide helpful insight for optimizing your design. When uploading a creative or website in Brainsight, a Clarity Score is provided, indicating how many hotspots attract attention, and what the size and distance between these hotspots are. The first two elements relate to Focus, the latter to (eye) Spread. Note that when clicking on the Focus and/or Spread metric, an explanation is provided on what these metrics mean, how they are calculated and how a visual can be optimized.
Interpreting Gaze Plots
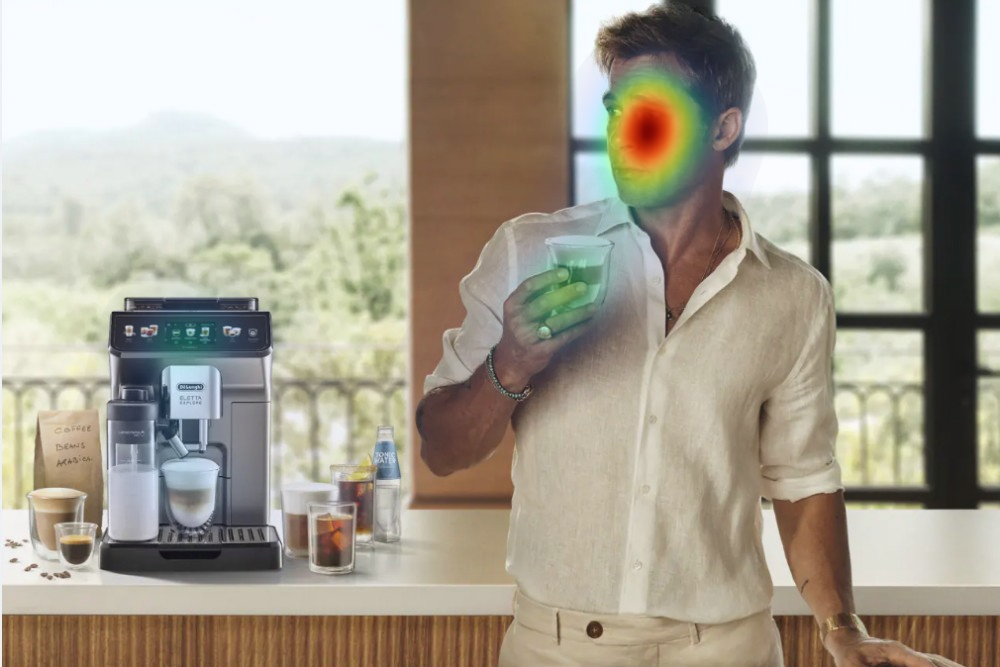
Our Gaze plots work hand in hand with our heatmaps and other features in Brainsight. Where heatmaps provide a more aggregated view of user attention, gaze plots give a more granular perspective. Heatmaps indicate areas of high and low attention, while gaze plots reveal the sequence of eye movements and the transitions between fixations, enabling a more detailed understanding of users' cognitive processes.
As mentioned earlier, when analyzing Gaze Plots, Focus and Spread are great indicators for optimization.
Let us show you an example of how we interpret and optimize a news site that makes use of a homepage takeover by one of their advertisers:
.png)
In this example, the (UX) design has a Clarity score of 38 out of 100, which is considered low compared to the benchmark. The main driver for this score is its spread: the homepage takeover, combined with the website’s content, creates multiple areas (all over the screen), attracting viewers' attention (hotspots), resulting in a cluttered image.
When looking at the fragmented hotspots and their sequence, you can image that following this pattern to scan the image takes quite some effort (a high cognitive load). This increases the risk of viewers ignoring it, having a low stickiness or brand recall, etc. For optimization, the Peekthrough- and Areas of Interest function are helpful to analyze the design. For instance, in this example we see that 7 elements (hotspots) drive attention, 6 due to the homepage takeover.

Questions can be asked like: are all of the elements required to get your brand and brand message across? Do they require to be in their current position/location?
When optimizing this ad, consider relocating, combining, grouping, redesigning and/or removing one or more of these elements to create more focus and attention, making the visual easier to process, understand and therefore increasing the ad impact.
After having created multiple design-variations, upload them and use the Compare function to validate which version has the best metrics.
Applications of Gaze Plots
Gaze plots can be used for various purposes.
Advertisement Evaluation: Assess the effectiveness of ads by analyzing where viewers focus their attention and attention hierarchy within an ad. Gaze plots play an important role in understanding visual attention and cognitive processing. Optimize design elements, headlines, and calls-to-action to ensure the right elements are seen and maximize engagement.
Website (UX) Optimization: By analyzing gaze plots, UX professionals can optimize the placement of critical information, improve visibility of important elements, and enhance overall user experience. Validate if your UX hierarchy makes sense and that your main CTA’s are not missed.
Key takeaway
Gaze plots are a valuable tool in (predictive) eye-tracking analysis, enabling researchers, designers and/or marketers to uncover insights into viewer- or user attention and their cognitive behavior.
By visualizing eye movements and fixations, Brainsight offers a comprehensive view of users' interaction patterns.


.png)