Creative Performance
How to pre-test & benchmark ads
When you have multiple ads and/or variants for a campaign, Brainsight helps to predict those variants that perform best on visual performance. It helps to point out which ones are likely to get noticed in-context, and compared to a peer-group of competing ads.
Currently, our advertising benchmarks cover Display Ads, Social Ads and (Digital) Out-of-Home. Brainsight helps to pretest your designs in order to optimize them ('pre-engineer' them for attention and clarity) before starting your campaign. The underlying principle here is that non-salient ads in their context contribute significantly to ad waste, which is better to avoid when being able to predict viewability up front, and focusing your advertising performance on the creative. Not seen = unsold.
Brainsight's ad-performance prediction is based on a combination of a benchmark -our database with 10.000+ competing ads from all over the world-, our set of templates to simulate in situ ad context, and our attention prediction algorithms that score 94% accuracy compared to live measurements (eye-tracking).
Benchmarked templates
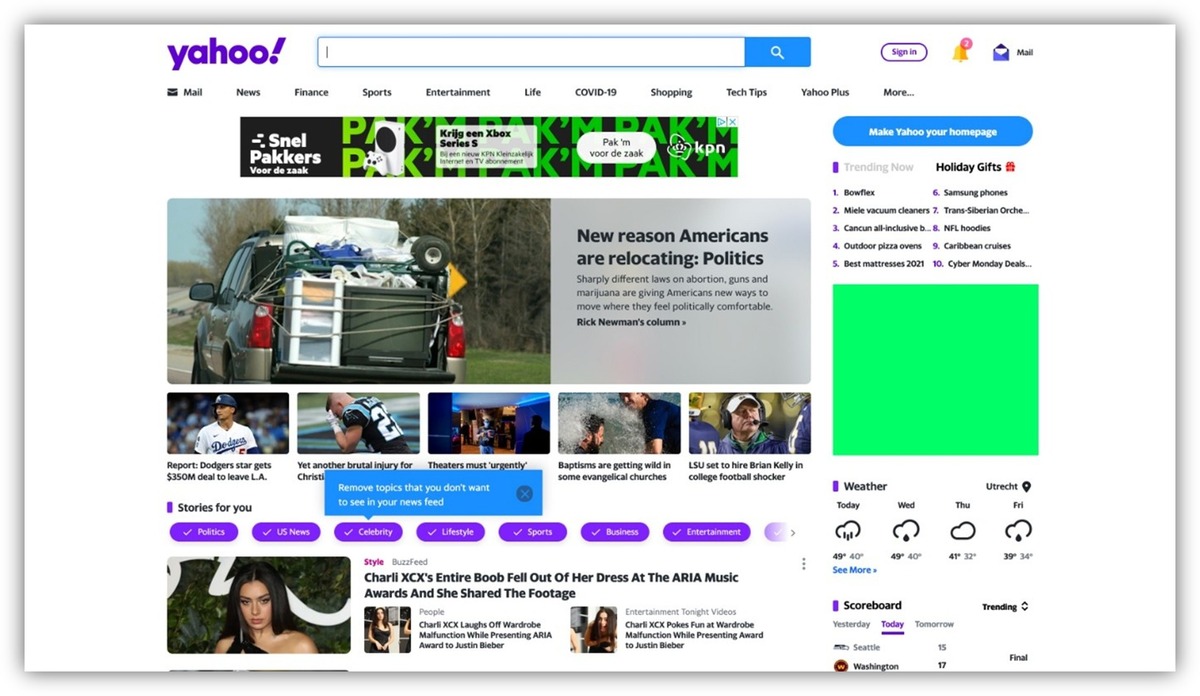
Our design-templates are representations of situations where your ad might appear. For social posts this is for example a LinkedIn or Facebook feed, for display ads it is a set of landing pages and for (Digital) Out-of-Home it is varies from busy shopping areas or train stations to quiet billboard outlets at night. Per category, dozens of situations were selected, also taking their circumstances into account, like dark / light mode for digital / online ads, mobile versus desktop, daylight versus nighttime for outdoor situations, etc..
See the example below for one of our display ad situations:

Upload, select template, done
Brainsight has automated the ad placements and resizing efforts. This is how it works. Firstly, all your uploaded ads are automatically placed in the templates-database, like the one above. Next, our engine does all the work to analyse them on situation (in-conetxt analysis) and your competing:
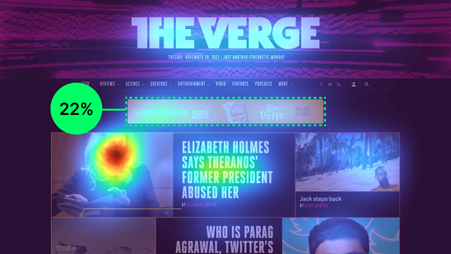
A) It creates a heatmap that predicts viewers' attention of the ad, including the content and its istractions for each design template.
B) It automatically marks your ad (annotating it) and calculates how much of the viewers' attention within the template is drawn to your ad. In the example you see for insatnce that the ad draws 22% viewer attention.
This is the first step towards the Predictive Attention Score or Your Ad in the Context of the chosen channel. In order to score it, we compare it to a baseline, which is where our benchmarks come in.
C) For each template category, we have pretested and analysed 10.000+ ads, calculating their relative attention scores, resulting in a data-set with a normal distribution where we can plot high and low scoring ads. The graph below is an example of a normal distribution. Brainsight verifies your ad score (in this example, 22%), and returns the percentile from the benchmark. For our example, a 22% relative attention seems to be better than 65% of the benchmark. To bring that score back to a more commonly used metric, the final Attention score is converted into a number between 0 and 100.
When your ad scores 65, it' means that it is better than 65% of your peer-group (the benchmarked, competing ads), which in this case is a good score.
.png)
Insights in just 4 steps
Benchmarking your campaign is easy and quick:
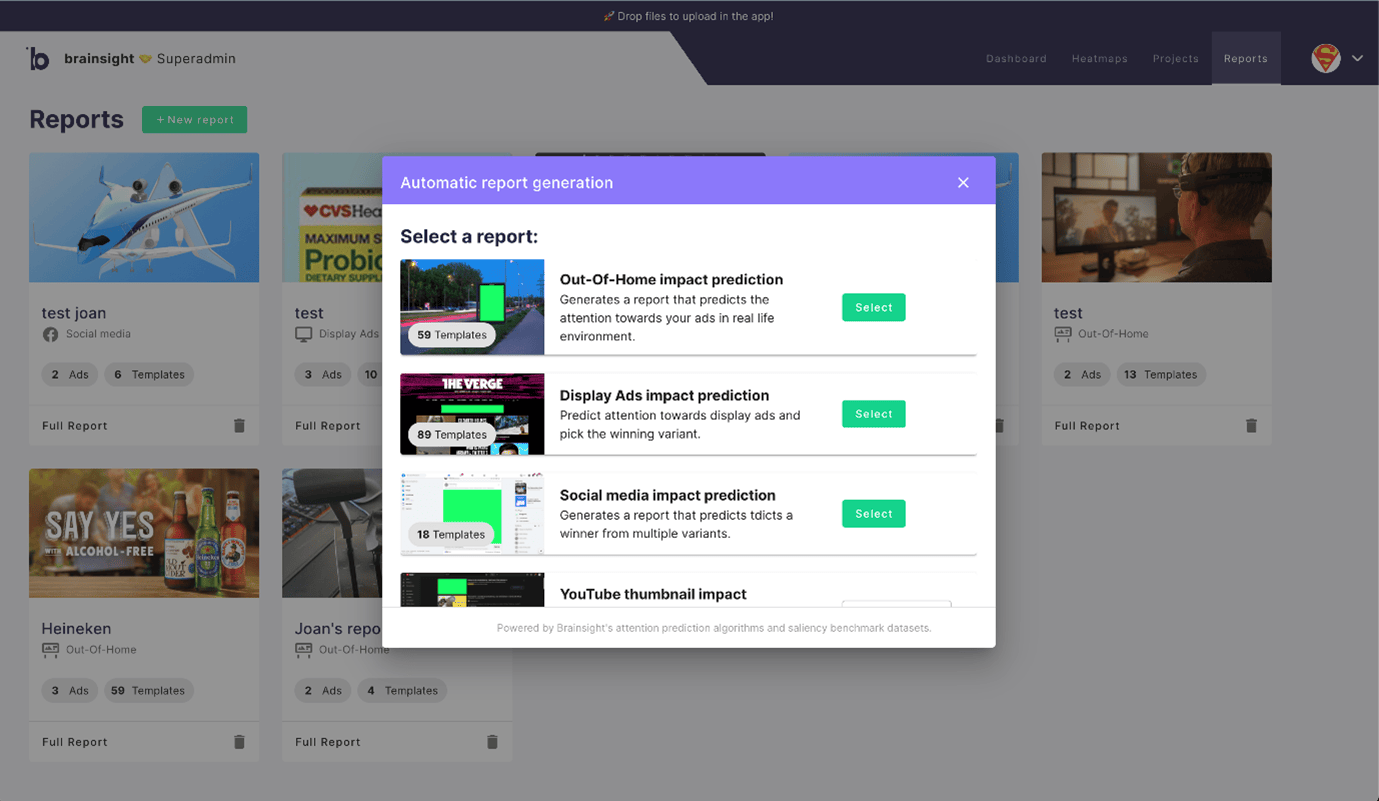
1. Go to Reports section in the Menu, and click on the '+ New report' button. This opens following wizard:
Choose one of the advertising categories and select the type of ad(s) you want to predict its impact of. In the example below, we'll pick "Display Ads impact prediction".
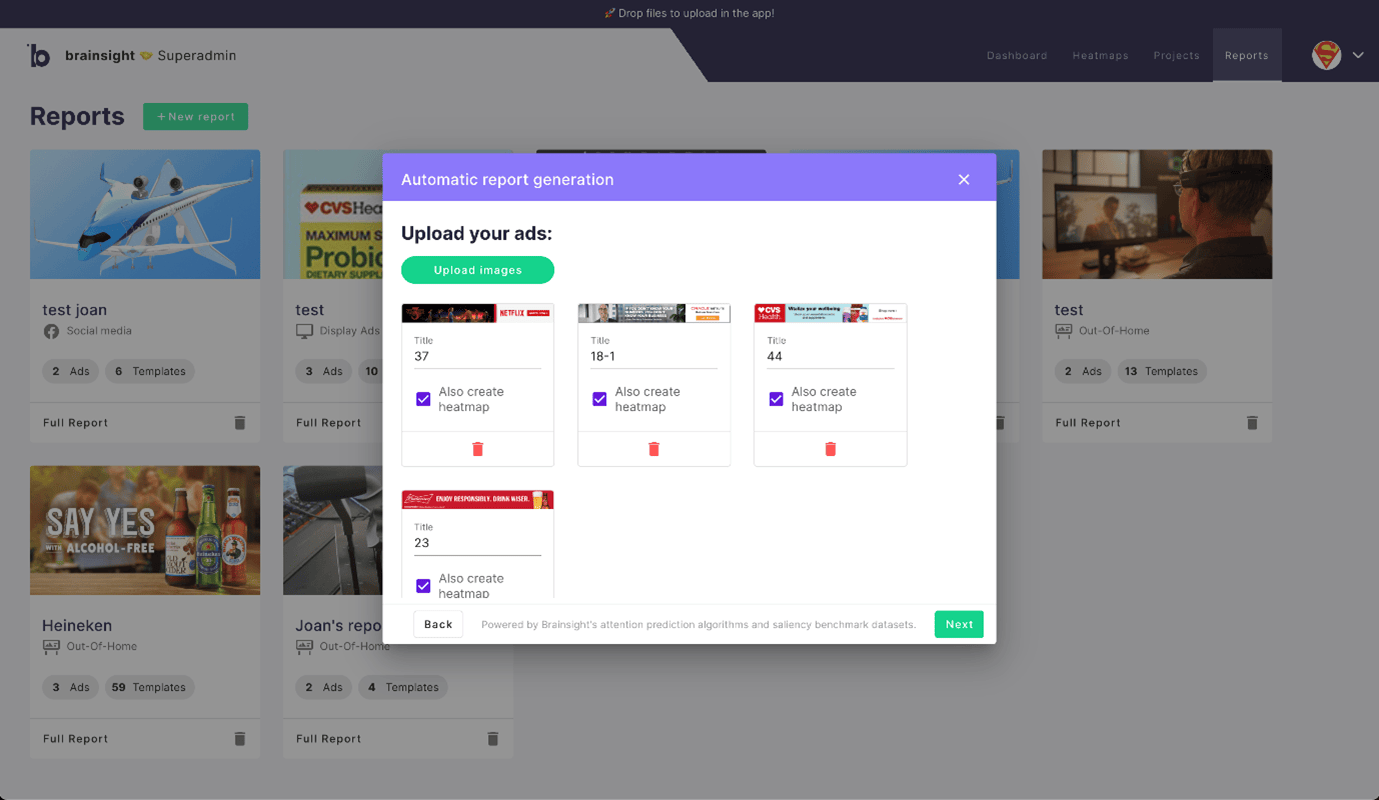
2. After adding a title of your project, upload your ad(s). You can choose to create heatmaps of the single ads as well, so that you analyse them later on (note that you can find them in your 'Heatmaps' overview / page)
3. Next step is to choose your preferred templates. Simply (de)select the design templates if you have a targeted campaign where you know where your ads will be placed, or select all. For Display ads you can also filter on the desired dimensions of the ad. In our case, we would only use templates for 728x90 ads. When filtered, don't forget to click 'select all' or manually pick the ones you think are most representative.
4. And... you're done! Click on 'create report' and within a minute or two (depending on the number of ads) you'll get the results. Now let's check that out!
Interpretation of the results
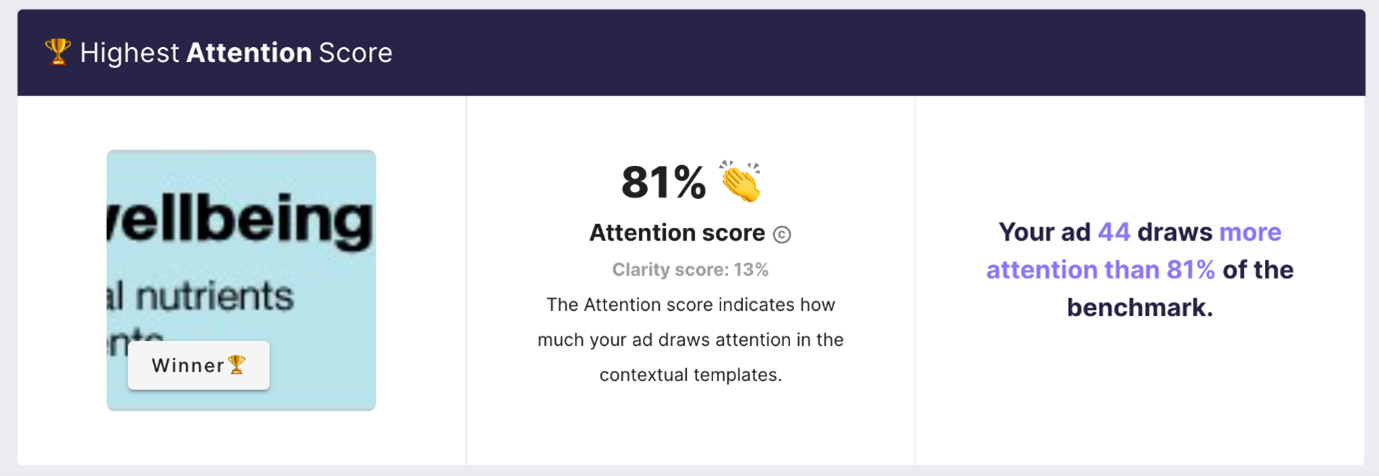
We have uploaded 4 ad variants for our example. The report now automatically shows the best scoring ad on attention: which ad is the most salient in its context and is likely grabbintg the most attention in the selected channel. As explained above, an attention score of 65 is good, above 80 it's excellent, meaning your ad is more salient than 80% of the benchmark. Congrats if you reach those scores!
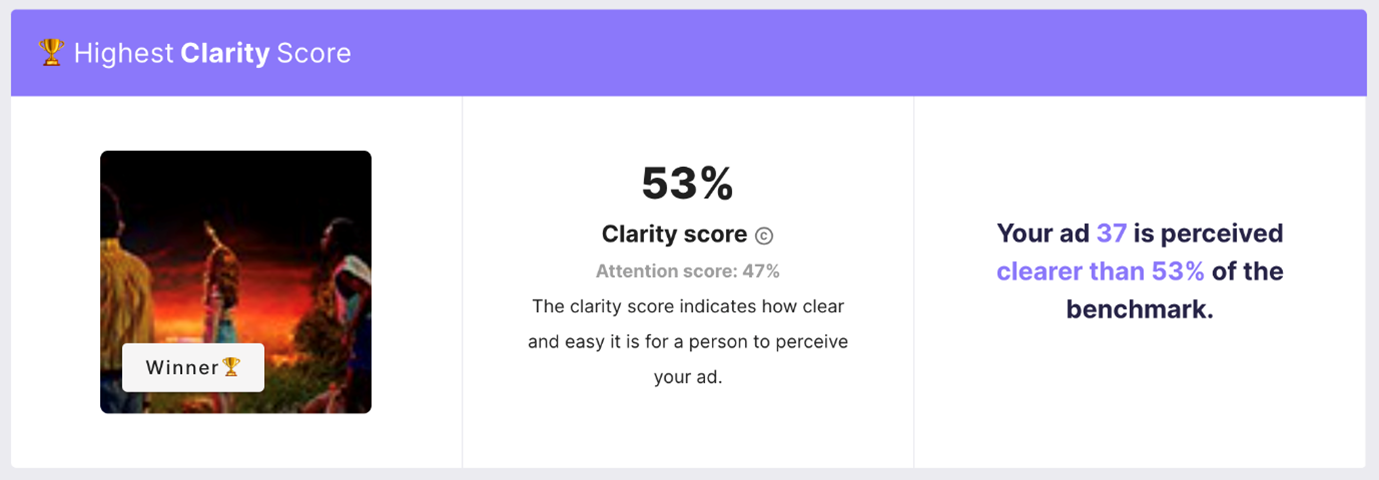
The benchmark report also generates the Clarity score per ad. The Clarity score is explained in a different article (read it here), but in essence it is a score between 0 - 100 that tells you how clear or cluttered your ad is, when people look at it. Does it have clear focus-points for the viewer / visitor when they are exposed to it (the first 3-5 seconds). Keep in mind that a high clarity score has no value when the attention score of the ad is poor (a great quality ad that is not see is not a great ad). Ensure that it is balanced.
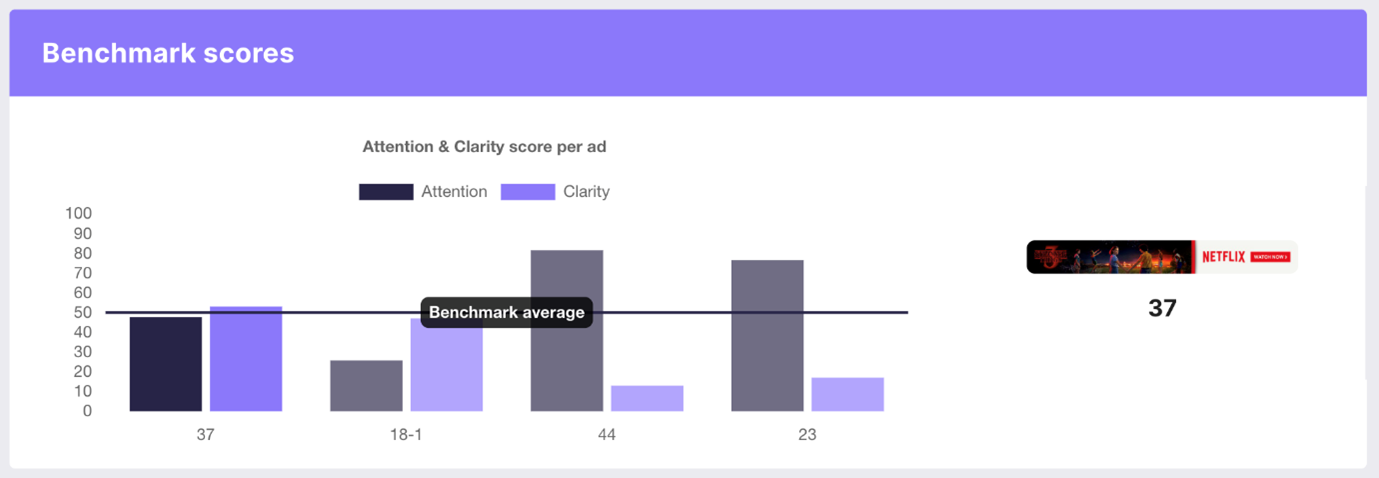
Therefore, look for the right combination. A helpful feature in is the Benchmark Score Chart, as shown below. Look for the ads with a good Attention- and Clarity balance and consider optimizing the ones that have a reasonable/good attention but low clarity and optimize or discard the poor performing ads on Attention, as they are likely to be missed in their current design. If you are still in the designing phase, you use these insights to analyse the heatmaps (all indiviidual ads are now in your dasbhoard as well), with the other features, like Areas of Interest, Peekthroughs and Gazeplots.
Now that you're all set, try the reports function and pretest your campaigns.

.png)

